Shawn — Intro
Evaluating Facebook advertising performance is much different than evaluating Google Ads performance. I suspect that’s because of the difference in intent.
In Google Ads search, prospects are actively looking and the data generally is clear. One-hundred prospects searched for a particular phrase, X% converted to sales (or leads), $X were generated.
Facebook, on the other hand, lacks intent. Prospects stumble upon our advertising and we hope it captures their attention in a distraction-prone environment.
That’s not an excuse to accept sloppy metrics — at the end of the day, CPA and/or ROAS matter most, no matter what advertising medium we use. However, when those numbers are not in line with our expectations or desires, we need to be informed and creative with our approach to understanding the metrics that matter.
Loren is closest to this work and, once again, I am thankful to have his insights make up the bulk of this module.
Before I turn over this module to Loren, however, I would like to draw your attention to something he mentions that is very important, and add my perspective as well.
Facebook metrics are far more useful for diagnostics (what worked, what didn’t) than for making predictions (what’s likely to work), and that means we need to have a far looser grip on this data than we might have with Google Ads.
The nature of enormous audiences, passive potential interest, and Facebook’s algorithm using its dataset and AI to find prospects who match the goals we’re optimizing for means we’re going to get data that is far more likely to change significantly over time.
One-hundred people searching for “plumber near me” today probably will behave similarly to one-hundred people searching for “plumber near me” a month from now.
However, one-hundred people clicking on your Facebook ad today may be significantly different in thirty days — with the same creative, same message, same offer.
There’s a Zen saying that you can’t step into the same stream twice, and I often think about that when discussing Facebook performance data.
The following is an excellent, concise overview of the metrics that matter. If you understand these, you’ll understand the story your data is telling you, and that is the critical first step toward improving performance and iterating your way to success.
Loren — Metrics and Performance Overview
Facebook does a good job of giving us a large amount of information to evaluate. For those who want to dig deep, there are some nuggets of gold buried in the data. There are also tons of extraneous and unhelpful metrics.
Like so many other principles in TTE, we want to find the 20% of effort that yields 80% of our results. With reporting, it is often closer to 5/95.
I like to think of metrics in layers. We have the primary metrics we care about, normally CPA (cost per acquisition). For your business, this might be cost per lead or cost per purchase. Some advertisers, particularly in the ecommerce space, also have ROAS (return on ad spend) as a primary metric.
Then there are some metrics a little below the surface which will greatly help us optimize our primary metrics. And there are deeper and deeper layers we can investigate if we want to diagnose some particularly tricky situations.
A doctor’s lab test can reveal the root cause of a disease and help diagnose why symptoms are felt. Similarly, when our primary metrics are off (the symptom), deeper layers of metrics can help us determine why. This isn’t always negative: sometimes these same metrics will help us see why something is doing well.
And just like a doctor’s lab test can proactively reveal problems before any symptoms are even present, we can use some of the deeper metrics to help us predict and then prevent a drop in performance.
I also like to think about metrics as telling a story. This is important. It’s easy to get bogged down in the quantitative data and stress about the details, rather than taking a step back and asking what all of the data is telling us.
Here are the metrics I spend the most time looking at.
Main Metrics
Obviously, our primary metric is crucial. That is normally CPA or ROAS, although some businesses may have other goals like cost per event registration.
Next, I look at CTR, CTR(all), CPM, CPC, and Frequency.
CTR is click-through rate. This is the percentage of times someone saw your ad and clicked the link to go to your landing page.
A high CTR is a sign of an ad that is engaging and getting a good response. However, a high CTR is only good news if you are doing a good job of prequalifying and receiving only high quality clicks.
For cold traffic, I like to see a CTR of at least 1%. Less than that is a sign I need to work more on my creative. An exception might be for local ads or some other difficult niche to target.
Retargeting ads may also have much higher CTR since the traffic is warm. On the other hand, retargeting ads may have much lower CTRs if you are chasing after high ticket sales. In that case, you may be fine with getting a small percentage of engagement because the ROAS is still good.
You will often notice a drop in CTRs as your ads are getting “stale” and are being seen time and time again by your audience. This is known as ad fatigue. A slipping CTR is most often the canary in the coal mine right before performance drops.
I also consider CTR(all). This is a similar metric to CTR — but instead of measuring clicks to the landing page, this measures all clicks on the Facebook ad. This would include clicking the landing page link, clicking the “See More” link, clicking to comment, clicking to like the ad, clicking to share, clicking to play a video, etc.
CTR(all) is a frustrating metric to explain. It’s not actually a true percentage of anything. To simplify it, just think of it as a multiple of CTR.
As an example, let’s say 100 people saw your ad. Three of them clicked “See More” and then clicked to visit your landing page. Your CTR would be 3%. Your CTR(all) would be 6% (twice your CTR because there were twice as many total clicks — you are counting both the “See More” clicks and the landing page clicks).
If 100 people saw your ad, nine of them clicked “See More,” with three of those clicking to visit the landing page, then your CTR would be 3% and your CTR(all) would be 12% (four times your CTR because there were four times as many total clicks).
For video ads, I don’t worry about CTR(all). Many videos autoplay depending on a user’s device and settings, so that play doesn’t count as a click.
For CTR(all) for image ads, I like to see that it’s a good multiple of CTR. Somewhere around 2-5 times. That’s a rough rule of thumb.
A super high CTR(all) compared to the CTR would tell me that people are clicking “See More” but not clicking over to the landing page. This would tell me either my image/intro copy is incongruent with the rest of the copy and the offer, or that my body copy is not doing a good job of engaging and driving clicks.
Likewise, if the CTR(all) was only 1.5 times the CTR, that would tell me that many people are clicking to the landing page before clicking “See More” and reading the body copy. There’s something in the ad enticing them to click the landing page immediately, and those clicks may not be as qualified as they would be if the body copy had been read.
If an ad works, it works. Don’t go back to the drawing board over these CTR(all) issues. But they could show us ways to potentially improve the ad in the future.
CPM is cost per mille, the cost of showing your ad 1,000 times. I’m going to explain some nuances of CPM, but first understand there’s really not much you can do to affect it directly. It’s a metric to help you see what’s going on, not one you should expend great effort trying to optimize.
CPM is a function of the competitiveness of the audience, Facebook’s estimation of the expected action rate, and then Facebook’s assessment of the quality of your ad. Much like Google ads, you are rewarded with lower ad prices if you provide a positive user experience.
A low CPM is not necessarily a great thing. This is due to some quirks of the algorithm.
The algorithm is out there roaming around trying to get us results at the lowest cost. Sometimes Facebook serves the ad to less expensive traffic that is lower quality.
Other times it will serve the ad to more expensive traffic that is more likely to engage with your ad. It is all a calculation to give you the lowest cost per result on average.
This means that higher CPMs also correlate with higher CTRs, and vice versa. Focusing on CPM alone misses the whole picture.
Despite the massive impact CPM can have on your CPA, there’s little you can do to affect it quickly.
The best course of action to lower your CPM is to test out new audiences, particularly ones that are broader and give the algorithm more room to roam. Other than that, our options are limited.
When your scale is small, CPM will be low because Facebook can pay very little to give you the low hanging fruit in your audience. CPM will rise with scale as the low hanging fruit runs out. This isn’t something we can prevent unless we just want to remain at a small scale forever.
Engaging creative that gets positive feedback from your audience will improve CPMs over time. Also CPM can be affected by positive activity on your page (regular posting on your page, good feedback, etc.). Facebook likes to see that you have a good brand on the platform. Likewise, negative feedback on your ads or lots of ad rejections lead to worse CPMs.
However, those are not quick fixes and they may not significantly move the needle.
There are also other strategies that may lower CPM, such as a campaign optimized for engagement that drives traffic to your winning ads. But these are not magic.
So what can we do with CPM measurements to actually make the information actionable?
First, CPM may help us diagnose wildly different performance. Holidays and other seasonal events may see higher CPMs as advertisers rush to Facebook to promote sales.
When working with new clients, CPM is one of the first metrics I am eager to look at. I’ve launched campaigns with new clients to find out we were getting a CPM of $100. Ouch. Pretty hard to have a profitable funnel that way.
I can counsel them to post more organic content to their page, and we can discuss targeting a different audience or using different optimizations. However, there’s a good chance that will be ineffective.
Properly diagnosing a high CPM allows me to manage expectations with the client. Facebook ads are going to be an uphill battle, and it’s largely because of factors outside of our direct control as an agency.
CPM also tends to inch up and up in the event of ad fatigue or an ad that is generating negative experiences. We may not change the CPM, but it can alert us to problems getting ready to happen.
The final measurement I look at is cost per link click, abbreviated CPC. This metric is the result of our CTR (how many clicks we’re getting) and our CPM (how much we’re paying to show our ads).
As I explained earlier, CTR and CPM tend to rise and fall together as Facebook sometimes pays more for higher quality traffic. CPC equalizes for that variance. Higher costs for higher quality traffic may have similar CPCs to an ad receiving lower costs for lower quality traffic. For this reason, CPC is often a clearer picture into ad performance. You may notice steep drops in CPC herald the start of campaigns falling off a cliff.
A final metric I evaluate is ad frequency. This is a measurement of how often ads were seen over a period of time. There are many ways to arrive at this number. You can measure this for one ad or a group of ads. You can measure it over different time periods. If a specific ad has a frequency of 2.0 over 7 days, that means each person who saw the ad that week saw it an average of two times.
Don’t stress over the details too much. It’s an important metric but the exact nuance of the time period or which group of ads to evaluate can overcomplicate it.
If I have a group of ads that are roughly similar in their creative, I like to see that group of ads with a seven-day frequency under two for cold traffic. Once an ad climbs over that threshold, performance may drop off.
However, I never turn off an ad simply because it has a high frequency. If it’s still getting good results, I let it run. Frequency is not a metric to optimize off of. It is merely a “check engine soon” light that helps us be alert to potential upcoming problems.
Custom Conversions and Down-Funnel Metrics
The above metrics will tell you most of the “story” of your ad performance.
But they lack any insight on the details of what happens after someone clicks over to your landing page. We can augment our reporting by firing pixel events and measuring down-funnel performance.
One quick note is that this off-platform data may be slightly inaccurate due to the nature of Facebook’s reporting. (On-platform activity like clicks are 100% accurate.) There are methods to increase accuracy like using CAPI, but that’s another ball of wax. Just know that even though these off-platform metrics are inaccurate, they may still give you a fuzzy picture of what’s going on.
Let me give a simple example of an ad leading to a one-page lead generation form.
We could take a look at the number of link clicks, the number of landing page views, and the number of leads to diagnose potential problem areas.
A landing page view is when a user clicks to your site, the website loads, and the Facebook pixel fires. You would think this would be the same as link clicks, but you would be surprised by how many people apparently don’t wait for a site to load.
If an ad had 100 link clicks, 93 landing page views, and 8 leads — then we know 93% of people stick around for the page to load and the landing page converts 8.6% of those people to leads.
I am looking for at least 85% of link clicks to turn into landing page views, so our example landing page is doing excellently at 93%. If that number runs significantly under 85%, it is time to work on page load speed.
In this example, our landing page conversion is an abysmal 8.6%. (I’m looking for at least 20% for leads.) In that case, either my ad is doing a poor job of prequalifying or my landing page copy and design are doing a poor job of closing the deal. Also another potential problem might be technical: perhaps the landing page form has issues or the page isn’t designed for mobile.
I can clearly see where the bottleneck is. Now I know where to focus in order to create the most improvement.
The previous example was a simple lead generation page. But we can apply the same principles to more complicated funnels.
For a purchase-based funnel, we could measure adds-to-cart. For webinar funnels, we could take a look at those who attended the webinar, those who visited the sales page, and those who added to cart. For an SOI-style multi page presell, we could measure page views throughout the entire MPPS.
This measurement can be achieved by firing the proper pixel events on each page and then creating custom conversions.
In fact, we can take this to the next level by using some Google Tag Manager magic and creating some additional custom conversions. In GTM, we can fire custom pixel events after someone has been on our sales page for a certain number of time, say 10 seconds.
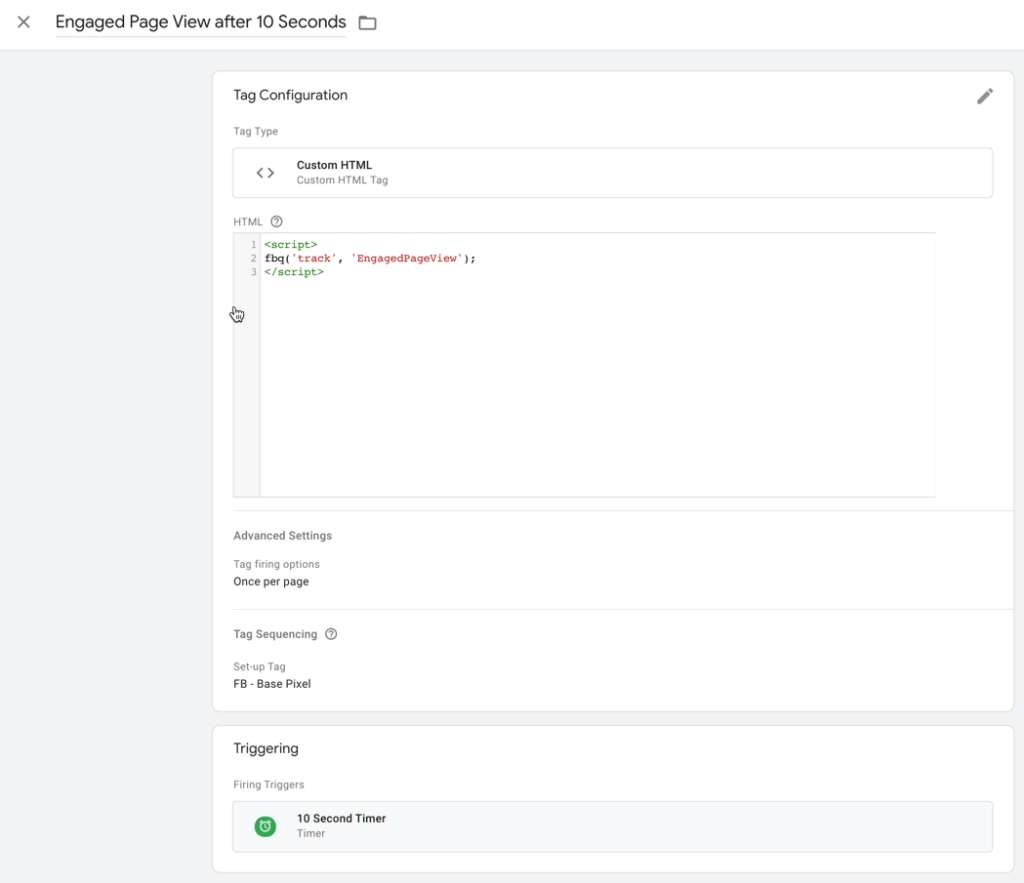
This gives us a little glimpse into who sticks around and engages with the page for a few seconds. Feel free to play with this and make it your own — you could fire multiple pixel events, you could use page scroll instead of timers, and you could set the timer length to a different time period. The possibilities are endless.
All of this data serves a diagnostic function. This rarely helps us optimize our ads in Facebook. This won’t serve a predictive function to help us take preemptive action within Facebook. But it does help us take a more holistic approach to diagnose and then address the entire process.
Reporting Dashboards and Custom Metrics Calculations
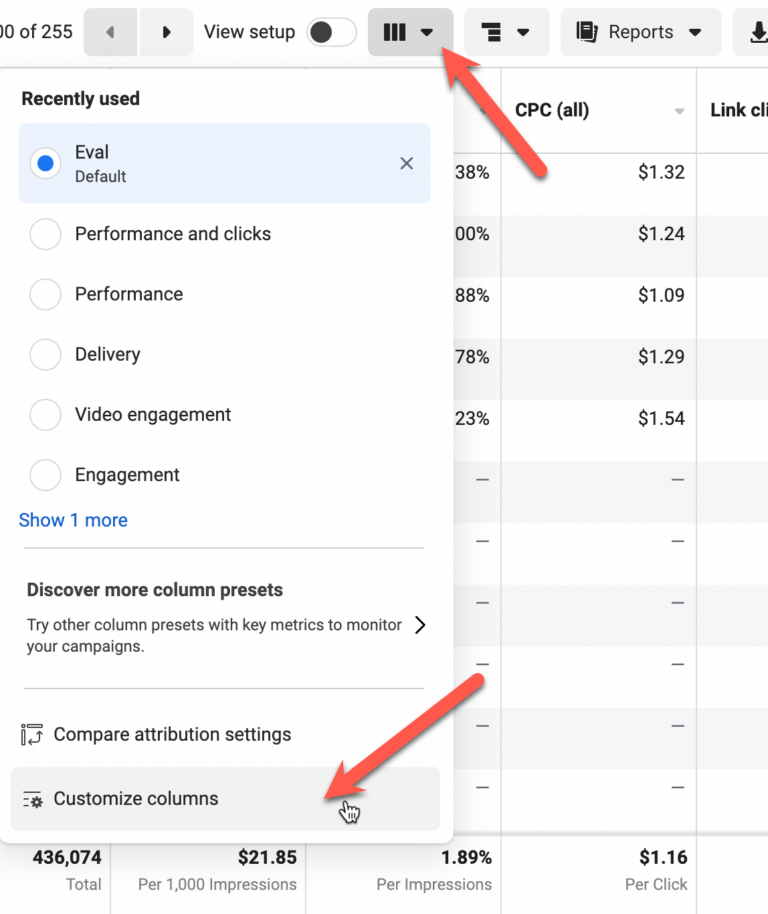
In Ads Manager, we have the ability to customize our columns and save various presets. There’s no right or wrong way to do this. I normally like to use one single dashboard with lots of data.
I will leave you with this one tip. In the Ads Reporting section of Facebook, we have the ability to create custom metrics. This is particularly helpful when we want to take a look at metrics that don’t exist within Facebook, such as landing page conversion rates.
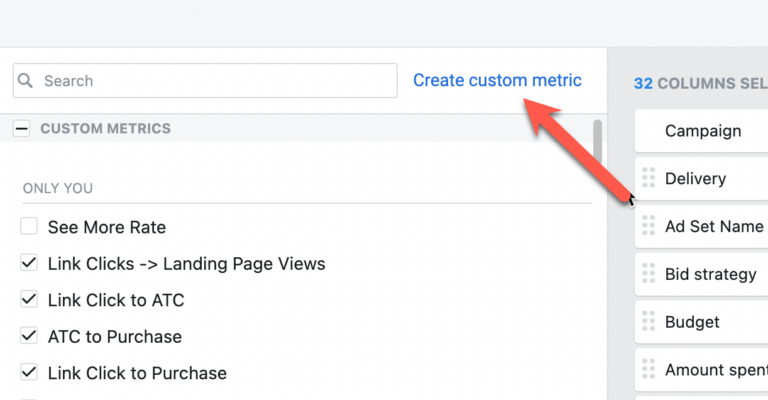
One quick tip: name your custom metric something like “Link Clicks -> Landing Page Views” instead of “Conversion Rate.” As we add more metrics, that bit of clarity will be helpful.
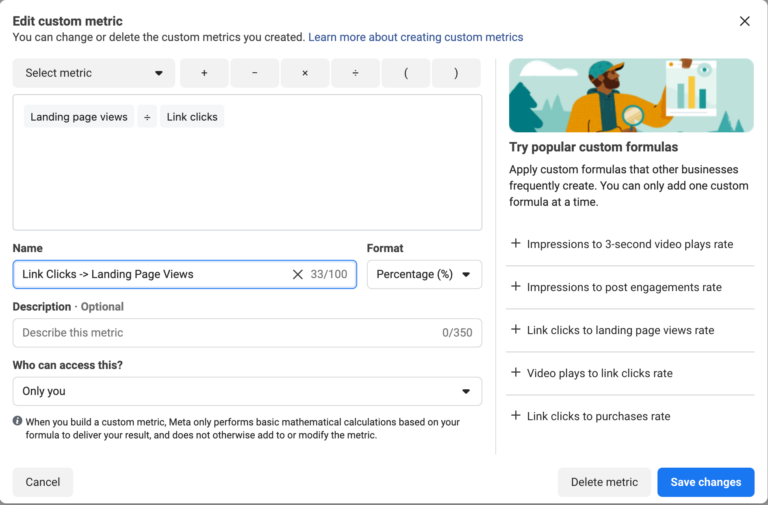
Without these custom metrics, we would have to manually calculate landing page conversion rates, import them into Google Sheets, or use some other third-party tool. But with Ads Reporting, we can create a custom metric using basic calculations.
The applications are many. This could be used to easily see the ratio between CTR(all) and CTR, the ratio of link clicks to landing page views, the ratio of leads to purchases — basically any ratio we could find useful.
Shawn — Summary
That’s a lot to consider, and I know what you’re thinking — where do I even start?
Metrics and performance data can’t be learned in a vacuum. You’re not going to learn how to evaluate Facebook ad performance until you’re running Facebook traffic and getting meaningful results (even if those results are on a small scale).
Once you have one Facebook ad running, start with the high-level metrics. What’s the cost-per-acquisition (typical funnel), or return on ad spend (e-commerce)? If you’re not selling anything immediately, what’s the cost per lead?
If you can’t answer these questions, the other metrics don’t matter until you can. We have to understand these top-level performance metrics so we can determine if our advertising is profitable, break even, or negative.
Once we know that, then we can begin to dig deeper into additional layers as Loren has outlined above. The other metrics, on their own, are meaningless — their value is in service to the bigger picture that we care about. If that bigger picture isn’t where we want it, account metrics will help us understand why (and point us toward ideas for improvement).
This is as much art as it is science, and it’s a skillset you’ll develop through practice. Don’t expect to know how to do this on day one. Run some Facebook traffic, get a result, and describe that result in the simplest terms possible.
For example, “I spent $25/day for four days to generate five sales at $47/sale”. That’s concise and meaningful.
Or “I spent $25/day for four days to generate 35 leads”. That’s also meaningful (assuming you know approximately how much a lead is worth to your business, or you’re prepared to spend some money to figure that out).
This high level is where you want to get comfortable and accurate first. Think in terms of your strategic intent (mentioned in module five, part II), and your performance relative to that intent.
When you’re meeting or exceeding your strategic intent, are you able to explain why? What’s working that is contributing to that performance?
If you’re not meeting the criteria for your strategic intent, are you able to explain why not? What is dragging performance down?
Answering these questions will help you get the most from this module. Start with the high level, and then go back through Loren’s metrics, layer by layer, to begin uncovering the story your data is telling.
The more often, and more thoroughly you do that the faster and more accurate you’ll become. I promise it will get easier over time as you get better, and your results will improve as well.
Return to this module every time you evaluate performance — weekly, at a minimum initially (2-3x per week is even better). Your efforts to learn how to evaluate advertising performance will pay significant dividends over time.
— Shawn & Loren
NEXT: Module 6.5: Facebook Offer and Messaging Testing Framework