I’m sure you know why you should track the effectiveness of your funnels. You don’t need me to convince you of the merits.
The question is, tho, which is the best tool to track visitor flow through your presell sites? And by track, I mean a visual funnel flow, like this:

Firstly, before I dive in, just know that I am not a tracking and analytics expert. If you’re looking to go deep with your tracking, I would recommend you check out Julian Juenemann over at MeasureSchool.com.
What I will share with you here is what I use get actionable insights about the “health” of our presell sites.
It’s a lean and lightweight workflow that tells me everything (the 80/20; the minimum effective dose) I need to know. It works perfectly for our needs.
This 80/20 workflow should be your baseline. Then layer on more if your needs require it.
What Your Tracking Tool Should Do for You?
Firstly, we install Google Analytics (through Google Tag Manager). Both are free. And it’s probably the Gold Standard for site-wide analytics.
The only code you install on your site is GTM. Within GTM all other code snippets are installed and managed, like GA and Mixpanel events.
The other benefit of using GTM is that you also get better reporting stats from the GTM data layer.
I’m sure GA can work for funnel flow, but I don’t use it for that (GA isn’t an event-driven tool). Mixpanel is a real-time event-driven tool which is better suited to track specific user events (actions). This is why we’ve been using Mixpanel for years for this job.
So our tracking and analytics stack looks like this:
GTM + GA + Mixpanel
Things To Consider When Choosing The Right Setup For Yourself
Firstly, when choosing the right setup for yourself:
- Our suggestion is to focus on a MED (minimal effective dose) approach out the gate,
- You should be able to track user events (actions) that people on your site take, rather than just page views (what did they click on?),
- You should be able to track the full length of user engagement (like time on page),
- You should be able to SEE (visualize) the entire user path you’re tracking,
- Ideally you should be able to set up the funnel visualization without having had created the funnel first (Mixpanel allows you to build a funnel on the fly, so long as you’re tracking events),
- You should be able to attribute users and actions to a traffic source easily.
As I already mentioned, I use Mixpanel for funnel visualization. It’s free for up to 20M data points per month (which means it’s unlikely you’ll ever need to pay).
(Hotjar also has funnel visualization as part of their free basic plan.)
What I love about Mixpanel is that you can “spin up” a funnel visualization on the fly, so long as you’re capturing the data points.
Here’s Justin Brooke explaining why he only uses Mixpanel (and the Google UTM URL Builder):

We also have Google Analytics running on all our sites. If you’re need help using GA and GTM, check out MeasureSchool and especially their YouTube channel.
For analytics and funnel visualization, this is **all you need** (and all the tools are free).
What You Should Track & Why
How detailed your tracking should be is up to you to decide. Like I’ve already said, we apply the “less is more” approach.
At the very minimum, you should be tracking the Mixpanel pageview events. Here’s how to set up Mixpanel within GTM:

Once done, you’ll see tracking right away (real-time), like this:
Example: We sent 607 people to it over a month. I can SEE the flow of people from the first to the final step in my PS.
That way I can see at which point I need to intervene to optimize my conversions, and ultimately make the PS more effective.
Once you’ve grasped the basics and have optimized what you can, you can then think about more intricate tracking and split-testing elements on a page to increase reader engagement.
We dive into a few advanced tactics later.
For now, here is short video from the Mixpanel YouTube channel giving you quick look at using funnels:

What To Do With the Data You Collect
Your Presell Site (PS) doesn’t need a lot of traffic to get statistically significant feedback and insights to see if something is working or not.
When I first write a presell, I don’t know how well it’ll grab the attention of the people I want to target. It’s always an iterative process of trial and error.
I put the presell live to test engagement (visitor flow through the presell site funnel). Then wait.
If it’s high (AffiliateBully.com has a 70%+ page 1 to page 2 clickthrough from referrer traffic), then I know I’m on the right track. I have their attention. I can work on optimizing that.
If it’s low, it “could” mean I may have missed something (which would need fixing), or that I’m perhaps targeting an idea that’s very narrow (which is not a bad thing).
I have created some presells where the page-one to page-two is “low” (like 25%), but they still created huge change (and results).
The takeaway here is to get good at reading the signals. The context. Like a fortune telling tea-leaf reader.
A “low” page-one to page-two doesn’t necessarily mean you’ve created a message to market match that’s misaligned.
When this happens, I don’t suggest scrapping your big marketing idea (hook), and starting over.
Rather, create an angles branch (path), like this:
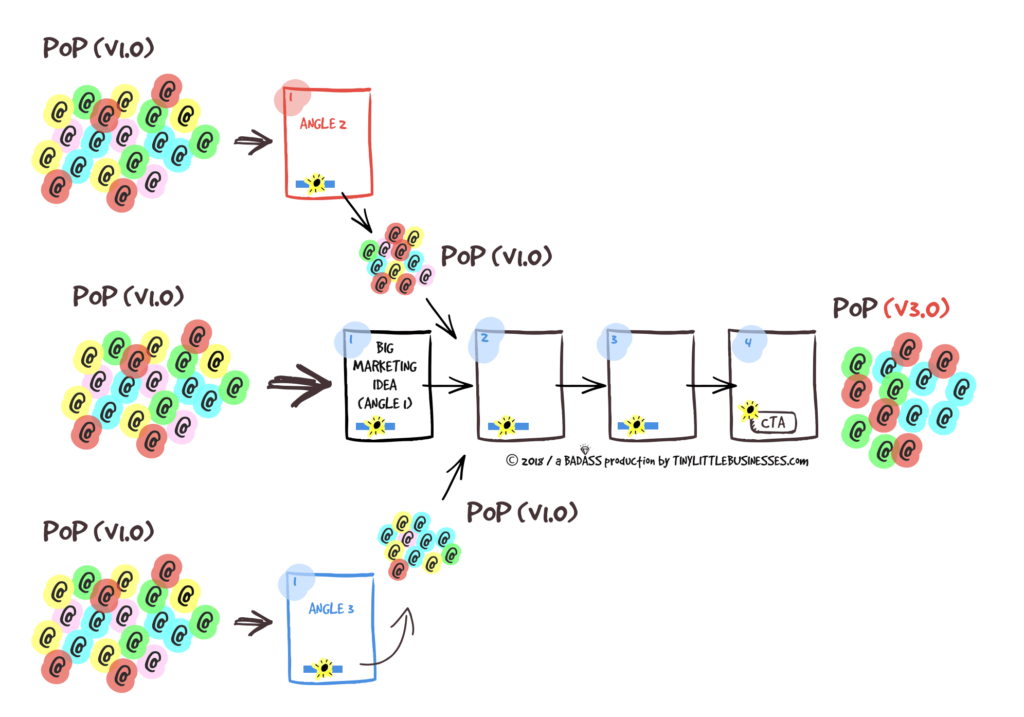
Example: In the three-path scenario above, the three entry points can be kept SEPARATE—
I have a ninja little WordPress plugin that I had built that manages this whole process. It’s an advanced technique so have left it out of the training (for now).
I’ll add in a lesson about the plugin later, and will give everyone access to it to use.
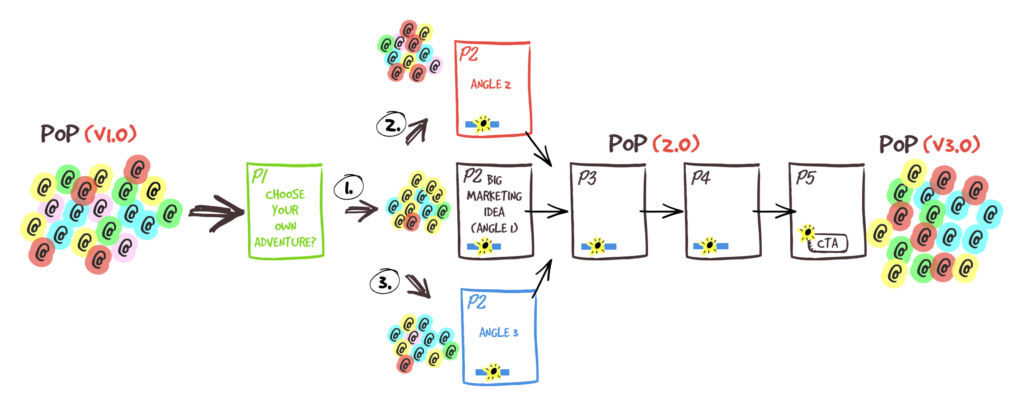
—or can be connected via a choose your own adventure page, like this:
Again, don’t think that you NEED a lot of people to get a sense of whether your PS is “connecting” or not. Here are stats from a ONE-day snippet from the presell funnel I showed you earlier:

As you can see, the ENGAGEMENT get’s higher after that first-page clickthrough, right up to the last step. That’s how it SHOULD be. Because:
- You’re filtering out people who are NOT a good fit (who will mainly bounce on the first page),
- You’re earning the ATTENTION of those who ARE connecting with your copy (story narrative),
- And commitment and consistency is kicking in, too.
- Then at the last step, because you’re usually asking people to make a more significant commitment than just to click on the “Next Page »” link; naturally, you’ll see a dip in the percentage actions taken. That too is normal.
Even from just 55 people I can see trends and gain insights. I always look at the data in the context of the full funnel flow; never at one step in isolation.
And the overall trends I spot will still look very similar even over a full month and 12x more traffic.
When testing, less traffic is in many cases better than more (especially when you’re paying for it).
I can LEARN A TON MORE INSIGHTS from 100 iterative experiments of 100 people than I can from one test of 10,000 people.
I create a “first version” then just put it out there in the wild and leave it for a bit. I send people to it via email and/or from various forms of content marketing (see traffic lesson).
I then iterate over time with the help of funnel visualization, by making sure my message connects with my reader deeper and deeper at each step in the PS process.
That’s pretty much it.
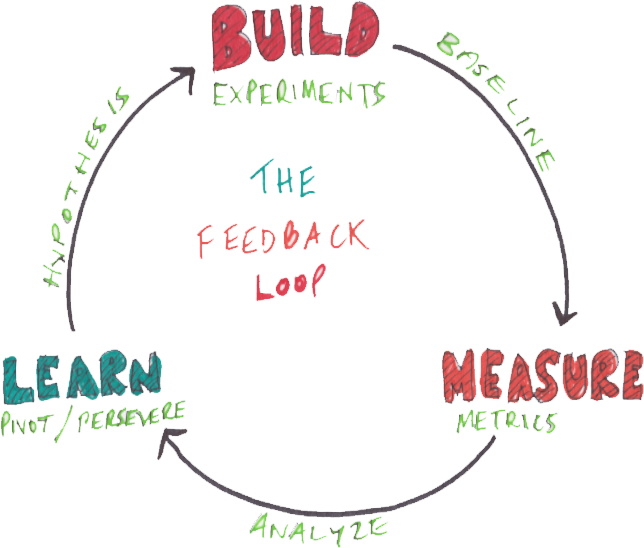
Start simple and lean. Test quickly. Iterate based on insights (short build, measure, learn, feedback loop).
End Of Preselling Sites Lesson